New Pew Study on Americans and Their Attitudes Towards Same Sex Marriage, Gender Identity, ETc.
 |
Pew Research Center has been tracking Americans’ attitudes toward same-sex marriage, gender identity and other LGBTQ+ issues for more than a decade. In that time, we have also done deep explorations of the experiences of LGBTQ+ and transgender and nonbinary Americans.
As the United States celebrates LGBTQ+ Pride month, here are five key findings about LGBTQ+ Americans from our recent surveys:
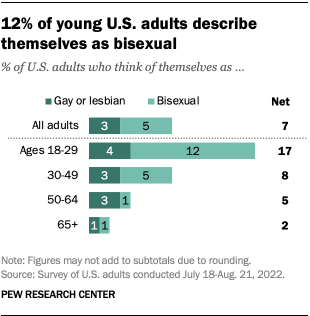
Some 7% of Americans are lesbian, gay or bisexual, according to a Pew Research Center survey of 12,147 U.S. adults conducted in summer 2022. Some 17% of adults younger than 30 identify as lesbian, gay or bisexual, compared with 8% of those ages 30 to 49, 5% of those 50 to 64 and 2% of those 65 and older. Similar shares of men and women identify with any of these terms, as do similar shares of adults across racial and ethnic groups.
More Americans identify as bisexual than as gay or lesbian. Among adults who are lesbian, gay or bisexual, 62% identify as bisexual, while 38% are gay or lesbian, according to the same 2022 survey.
Among Americans who are lesbian, gay or bisexual, the vast majority of women say they are bisexual (79%) while the majority of men say they are gay (57%).
Adults younger than 50 who are lesbian, gay or bisexual are far more likely to identify as bisexual (69%) than as gay or lesbian (31%). The opposite is true among those ages 50 and older: 66% identify as gay or lesbian and 34% as bisexual.
Bisexual adults are far less likely than gay or lesbian adults to be “out” to the important people in their life, according to a 2019 Center analysis of survey data from Stanford University. Only 19% of those who identify as bisexual say all or most of the important people in their life are aware of their sexual orientation. In contrast, 75% of gay or lesbian adults say the same. About one-quarter of bisexual adults (26%) say they are not “out” to any of the important people in their life, compared with 4% of gay or lesbian adults.
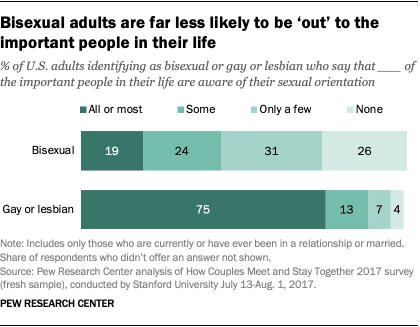
One factor that might contribute to bisexual adults being less likely to be “out” is that most (82%) bisexual men and women who are married or living with a partner are in a relationship with someone of the opposite gender, according to a new Center survey.
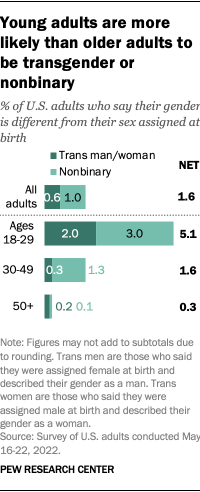
Some 1.6% of U.S. adults are transgender or nonbinary – that is, their gender differs from the sex they were assigned at birth. Adults under 30 are more likely than older adults to be trans or nonbinary. Some 5.1% of adults younger than 30 are trans or nonbinary, including 2.0% who are trans men or trans women and 3.0% who are nonbinary – that is, they are neither a man nor a woman, or not strictly one or the other. (Due to rounding, subtotals may not add up to the total.) This compares with 1.6% of those ages 30 to 49 and 0.3% of those 50 and older who are trans or nonbinary.
The share of U.S. adults who are transgender is particularly high among adults younger than 25. In this age group, 3.1% are trans men or trans women, compared with just 0.5% of those ages 25 to 29. There is no statistically significant difference between these two age groups in the share who are nonbinary.
While a relatively small share of U.S. adults are transgender or nonbinary, many Americans say they know someone who is. More than four-in-ten U.S. adults (44%) say they personally know someone who is trans, and 20% know someone who is nonbinary.
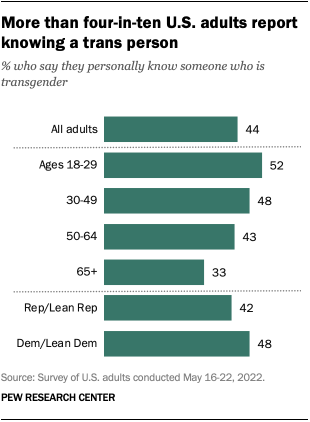
About a quarter of U.S. adults (27%) say they have a trans friend, while 13% say they have a co-worker who is trans and 10% say they have a trans family member. About one-in-ten adults (9%) say they know a trans person who is younger than 18.
A 2021 Center survey found that 26% of U.S. adults personally knew someone who goes by gender-neutral pronouns such as “they” instead of “he” or “she,” up from 18% in 2018.
Note: This is an update of a post originally published on June 13, 2017. Findings from two surveys were used in this analysis
Comments